

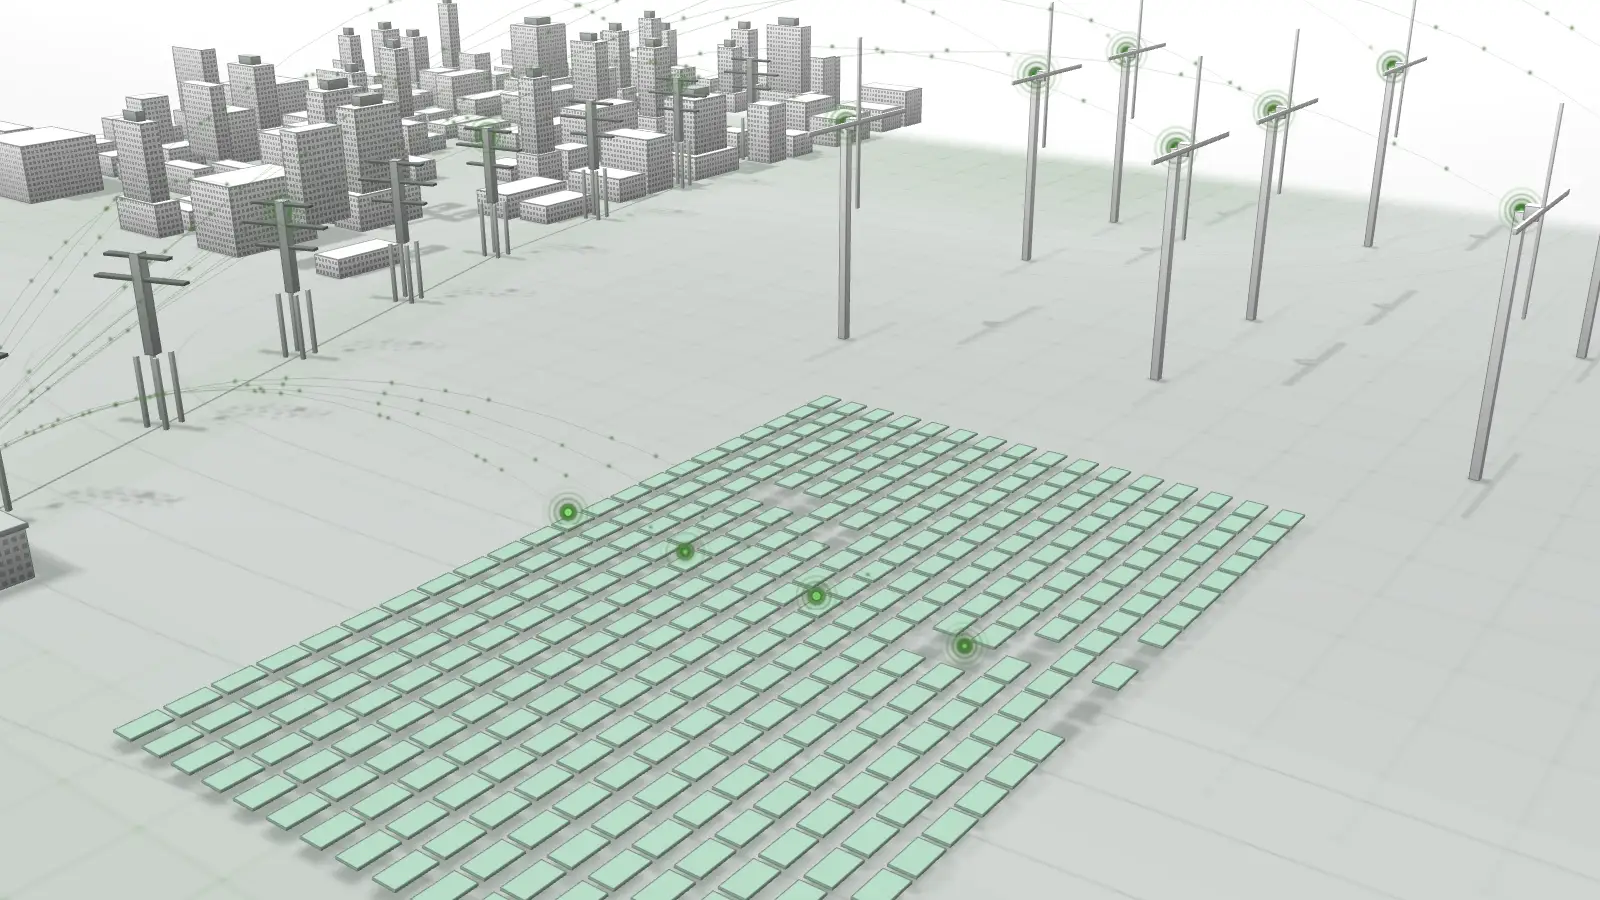
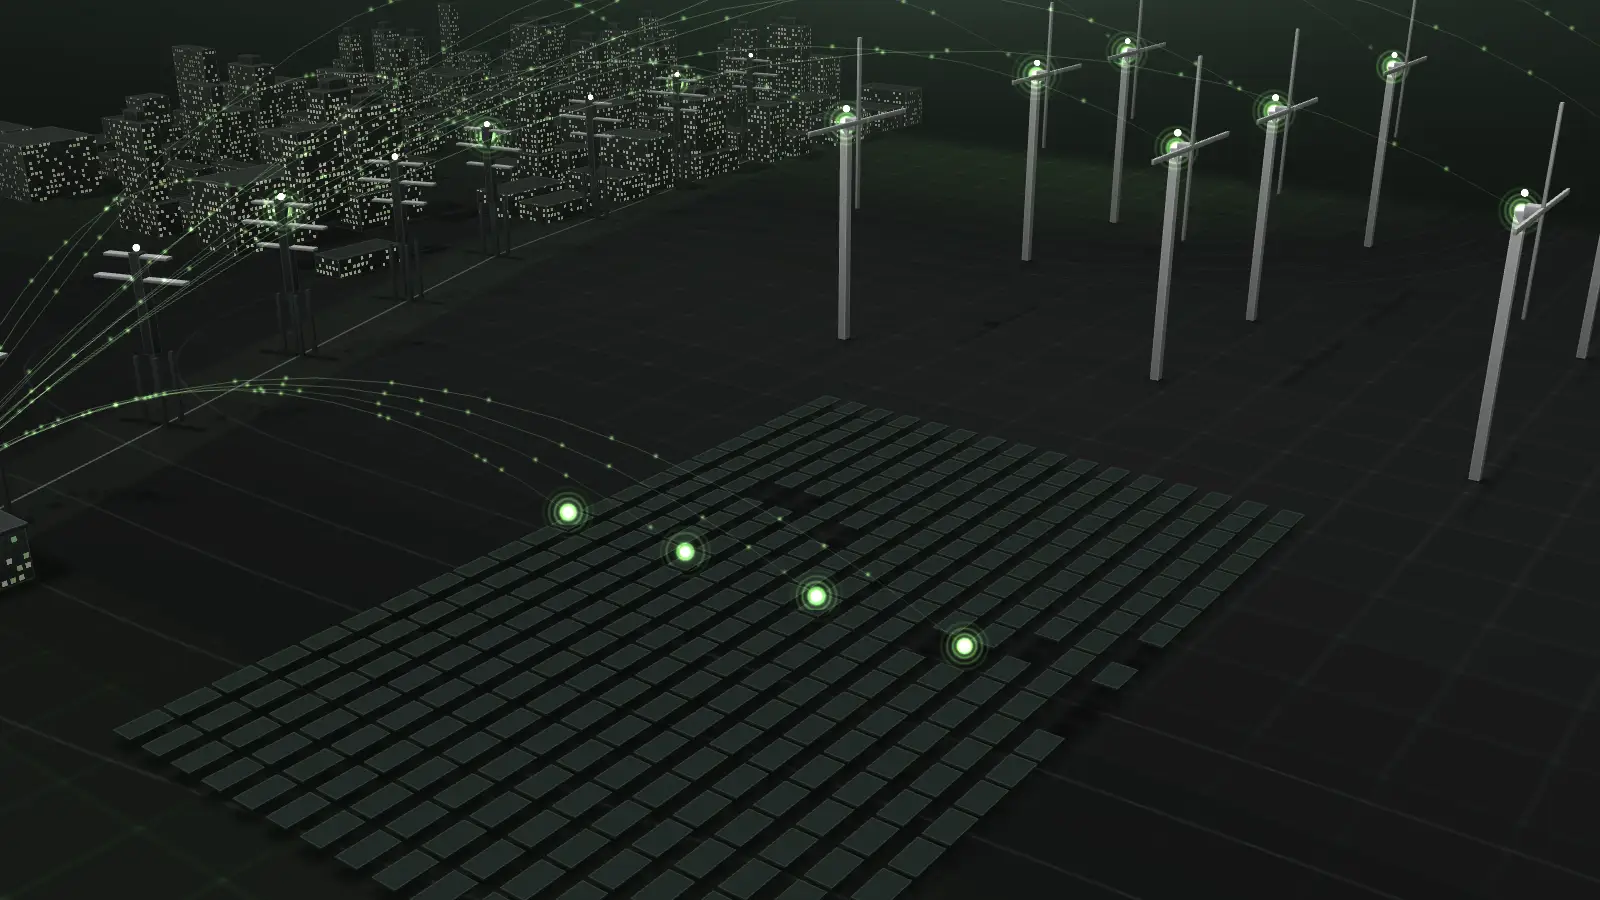
Grid maintenance is a rationing problem. You have thousands of transformers spread over hours of road, and a few crews. On Monday morning, the question is where to send the people you’ve got. Every sensor, drone flight and model in this article should serve that one decision.
Use the data you already have
SCADA is the natural starting point, because it is already there. It gives you load, voltage and tap changer operations, and sometimes oil temperature and alarms at larger substations. Running hot and overloaded for long periods ages insulation, so load history alone tells you something useful. But SCADA was designed to operate the network. It says little about condition on its own, and coverage thins out at distribution level.
Take your copy through the historian or a demilitarised zone. Nothing in a monitoring project needs a path back into control systems.
Match the sensors to the asset
Spending should follow consequence.
For large power transformers, online dissolved gas analysis is often justified. Faults inside the tank produce characteristic gases, and IEEE C57.104 and IEC 60599 give guidance on reading them. The trend matters more than any single sample, so a steady rise deserves attention before it crosses a limit. Add bushing monitoring and winding temperature if your failure history points that way.
For mid-sized units, regular oil samples and a few temperature sensors may be enough.
For the many small distribution transformers, monitoring each one usually costs more than it saves, and replacing them when they fail can be the right answer. Look at feeder or meter data for overloads and voltage problems, and add cheap temperature and oil-level sensors only on units serving critical loads. LoRaWAN or NB-IoT can bring those readings back without new cabling, but test coverage on the ground first.
What drones add
Thermal and visual surveys catch hot connections, oil leaks, damaged bushings and encroaching vegetation. A survey is a snapshot, though, and thermal readings depend on load at the time, so fly at peak hours where you can. Let a computer vision model sort the images and flag defects for a person to confirm, and tag every finding with an asset ID. Pictures that aren’t linked to an asset are seldom looked at again.
Ranking the work
Failures are rare, so you won’t have enough labelled examples to train a sophisticated model at first. Start with a plain score that engineers can read: likelihood from condition and load trends, multiplied by consequence. Consequence covers who is fed from the unit, whether there is a backup supply, and how long a replacement takes to source.
Then put it to work. Give dispatchers a ranked list with the reason next to each item. Group nearby jobs to cut driving time, and let engineers overrule the ranking when they know better. A model that can’t be overruled will soon be ignored.
Record what each crew finds on arrival. Those findings are your most valuable data, because they tell you whether the ranking is right. After a few years, they also give you the labels a better model would need.
Start by looking backwards. Take your last ten transformer failures and, for each one, ask what data would have warned you and whether you already held it. Then pick the group of assets where the answer was most often yes, and run your first pilot there.